
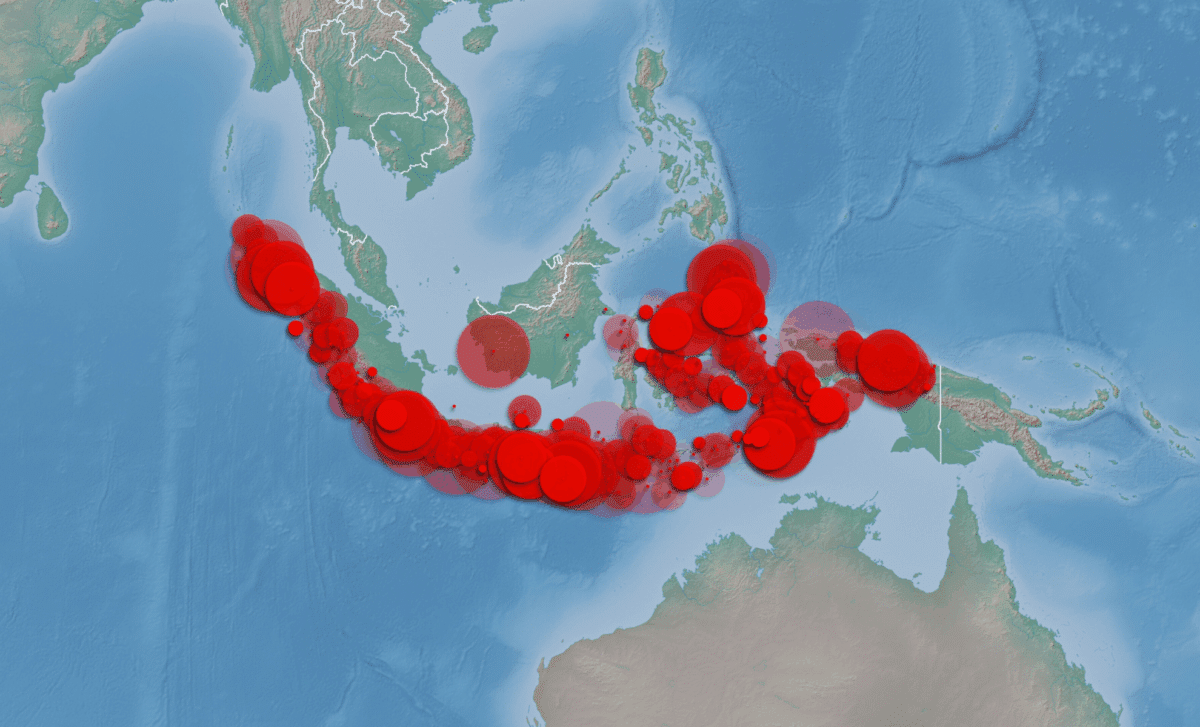
Earthquakes represent some of the most powerful natural phenomena, but pinpointing their future locations has long been a challenge. A recently developed worldwide stress map, incorporating over 100,000 data points, identifies zones within the Earth's crust that are under the greatest strain and at risk of rupture. This innovative resource promises to transform earthquake science and improve the safety of drilling operations. Created by researchers from the GFZ Helmholtz Centre for Geosciences and collaborators at The University of Queensland, the map sheds new light on the dynamic forces influencing our planet’s geology.
Behind the Global Stress Map Initiative
The collaborative effort between the GFZ Helmholtz Centre for Geosciences and The University of Queensland has culminated in a substantial update to a former global stress map, expanding its dataset by more than double since 2016. The map compiles extensive measurements of maximum horizontal stress (SHmax) orientation and magnitude within the Earth's crust. By analyzing these stress orientations, scientists can identify tectonically vulnerable regions, enhancing earthquake forecasting and informing safer drilling practices.
This project's impact extends beyond earthquake prediction. Crustal stress affects diverse activities such as geothermal energy extraction, carbon sequestration, and deep-waste disposal. Mapping these stress regimes allows engineers and geoscientists at GFZ Helmholtz Centre and The University of Queensland to guide projects that interact with or influence tectonic stresses more effectively.

Insights from the Updated Stress Map
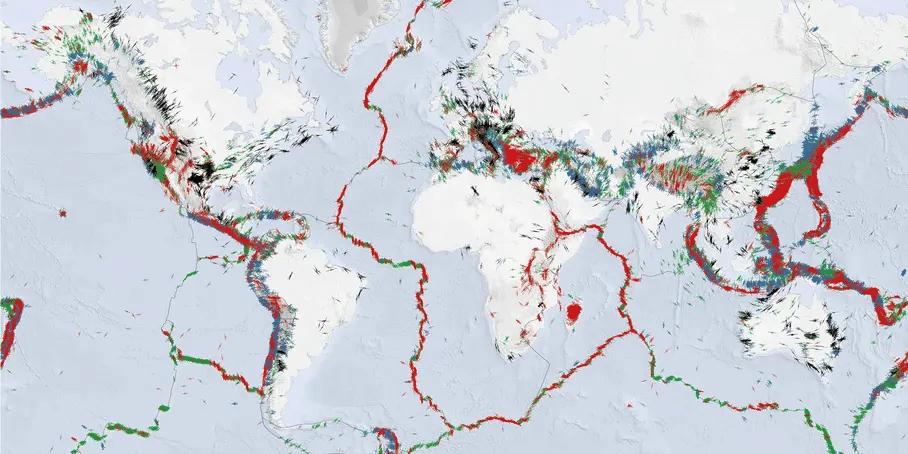
The enhanced map clarifies the spatial distribution and nature of potential crustal failures. It illustrates different faulting styles—normal (red), strike-slip (green), and thrust faulting (blue)—using color-coded markers, aiding scientists and engineers in evaluating the prevailing tectonic stresses that could trigger seismic activity.
The map specifically tracks the orientation of SHmax, representing the direction of highest horizontal stress. Data originates from multiple sources, including seismic activity, borehole measurements, and field observations, producing a consistent global picture of stress alignment. Moreover, the addition of nearly 3,000 new deep borehole data points improves data resolution, especially in previously under-sampled regions.
Unexpected Stress Rotation in Australia’s Bowen Basin
A remarkable finding in the Bowen Basin of eastern Australia showed a pronounced rotation of SHmax direction by more than 50 degrees over a mere 62 miles. Documented in a detailed high-resolution study, this highlights how local geological variations, such as changes in rock density, can drastically modify stress patterns across short distances. This evidence reinforces the complex interplay between global tectonic forces and localized geological features.
The clear practical implication is that even nearby drilling sites can experience vastly different stress conditions, necessitating tailored drilling strategies. Accurate knowledge of these local variations is critical for enhancing drilling safety and minimizing seismic hazards artificially induced by such activities.
Advancing Safe Drilling and Earthquake Hazard Mitigation
Exploration for geothermal resources, oil, and gas involves inherent risks, as human-induced changes to subsurface pressures can trigger seismic events. The new global stress map identifies safer drilling corridors by exposing areas where subsurface stresses are less likely to cause fault slippage. With foreknowledge of stress orientations, engineers can optimize well trajectories and designs to prevent operational difficulties such as stuck pipes and blowouts.
This mapping effort also supports managing human-triggered earthquakes. As noted by the USGS, activities like fluid injection elevate pore pressures, possibly activating dormant faults. The updated stress map enables scientists and industry stakeholders to predict zones susceptible to such events, improving planning and risk reduction.
Embracing Data-Driven Progress in Earthquake Research
The enriched dataset assembled for the stress map marks a transformative moment for earthquake research and risk evaluation. The expansion in data density and the introduction of a new database platform facilitate rapid incorporation of new measurements, ensuring the map remains current and dynamically reflects the evolving stress environment.
Emergency management personnel benefit immensely, using the map to model potential seismic scenarios near urban centers and critical infrastructures like dams. This predictive capability empowers planners to formulate more robust preparedness plans and response protocols in anticipation of earthquake threats.
- Categories:
- Science


0 comments
Sign in to Comment